Stocks eased off this week. On Tuesday, it was more like a tumble than an easing but when the week was over major averages had given up roughly half a percent. After two weeks of strong gains, this was a bit of a disappointment but then it's not unexpected to see rallies pause now and then.
The question now is whether the rally can get back on track. We'll try to look for the most likely outcome in the following charts. They're derived from data collected during our Alert HQ process and they provide a high-level look at a number of the indicators we track across the whole market.
The view from Alert HQ --
Let's start with our moving average analysis.
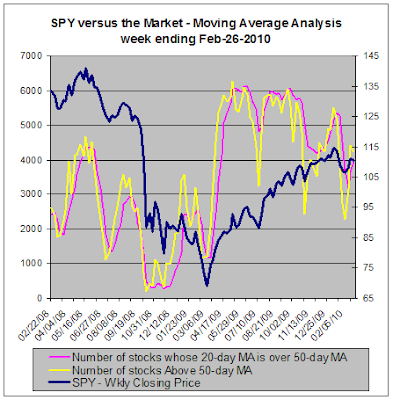
For this first chart we count the number of stocks above various moving averages and count the number of moving average crossovers, as well. We scan roughly 7000 stocks and ETFs each weekend and plot the results against a chart of the SPDR S&P 500 ETF (SPY).
The chart above shows that the number of stocks above their 50-day moving average has decreased only slightly. The number of crossovers actually increased this week. So this doesn't seem like a picture of a market rolling over.
The next chart provides our trending analysis. It looks at the number of stocks in strong up-trends or down-trends based on Aroon analysis.
Here we see that the number of stocks in downtrends decreased again this while the number of stocks in uptrends increased. Though the number of stocks in downtrends is beginning to approach extreme levels, the number of stocks in uptrends is no where near an extreme level. This implies that not only does this market still show some strength but it also appears that there is still room for further gains.
Conclusion --
As we review the charts above, it sure looks like this week's setback was minor.
In the physical sciences, they say that a body at rest tends to stay at rest and a body in motion tends to stay in motion unless acted upon by an outside force. This market is still in motion and the direction is still up. Barring any unforeseen shocks to the system from Greece, China or Washington, it still looks like this rally has some life left in it yet.


Comments
Post a Comment