OK, stocks rallied this week. But does the rally have legs?
Sometimes the market rallies inexplicably. Given the bad news in economic reports this week, it looked like we might see another crash. We saw GDP come in with a 0.3% decline, a precipitous drop 3.1% drop in consumer spending, jobless claims stubbornly staying at recession-like levels, a major decline in the Chicago PMI and mixed numbers in the durable goods report.
Despite all this, stocks rose. Perhaps investors felt all the bad news was priced in and stocks were finally cheap enough to buy. I am beginning to think that we may see more buying.
In the chart below, we show the results of plotting this indicator against SPY, the S&P 500 SPDR ETF.
In general, you can see that our moving average indicator follows the ups and downs of the S&P 500. In order to get more of a prediction on the direction of stock prices, let's add another moving average to the chart. When you plot the number of stocks trading above their 50-day moving average you begin to see some interesting patterns emerge.
What jumps out from the chart is that when the number of stocks trading above their 50-day moving average (the yellow line) crosses the line that tracks the number of stocks whose 20-day moving average is above their 50-day moving average (the magenta line) you will get a change in the trend of the S&P 500.
What is significant in the chart above is that the yellow line (50-day MA) has been above the magenta line (20-day MA over 50-day MA) for three weeks now. As of the most Friday, however, the yellow line made a strong move above the magenta line signaling more broad-based strength and momentum then we have seen in months.
This combination of moving averages is reminiscent of the classic MACD (Moving Average Convergence Divergence) technical indicator and can be used in the same way.
Given that my indicator reflects action in the stock market as a whole, a way to use it is to go long index funds when the trend appears to be turning upward. For example, a week or so ago I somewhat prematurely nibbled at the ProShares Ultra S&P 500 ETF (SSO). Since then I have added a bit of the ProShares Ultra QQQ ETF (QLD).
Now that we are into November, perhaps we will be able to say "Yes, Virginia, there is a Santa Claus rally!"
Disclosure: long SSO and QLD
Sometimes the market rallies inexplicably. Given the bad news in economic reports this week, it looked like we might see another crash. We saw GDP come in with a 0.3% decline, a precipitous drop 3.1% drop in consumer spending, jobless claims stubbornly staying at recession-like levels, a major decline in the Chicago PMI and mixed numbers in the durable goods report.
Despite all this, stocks rose. Perhaps investors felt all the bad news was priced in and stocks were finally cheap enough to buy. I am beginning to think that we may see more buying.
Moving Average Analysis with a twist --
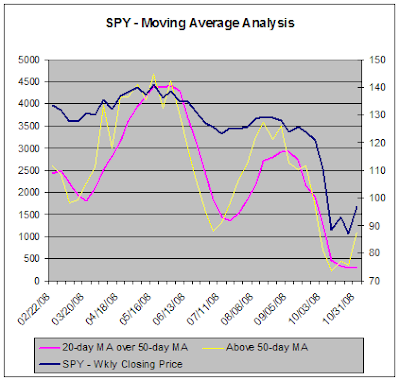
Below we present some statistics derived from the TradeRadar Alert HQ process. Each week we scan 7200 stocks on the NYSE, the AMEX and the NASDAQ and run a number of technical analysis screens against each one. One of the indicators I have found to be reliable this year is tracking how many stocks have their 20-day moving average above their 50-day moving average.In the chart below, we show the results of plotting this indicator against SPY, the S&P 500 SPDR ETF.

In general, you can see that our moving average indicator follows the ups and downs of the S&P 500. In order to get more of a prediction on the direction of stock prices, let's add another moving average to the chart. When you plot the number of stocks trading above their 50-day moving average you begin to see some interesting patterns emerge.
What jumps out from the chart is that when the number of stocks trading above their 50-day moving average (the yellow line) crosses the line that tracks the number of stocks whose 20-day moving average is above their 50-day moving average (the magenta line) you will get a change in the trend of the S&P 500.
What is significant in the chart above is that the yellow line (50-day MA) has been above the magenta line (20-day MA over 50-day MA) for three weeks now. As of the most Friday, however, the yellow line made a strong move above the magenta line signaling more broad-based strength and momentum then we have seen in months.
Conclusion: the rally is real, for now --
Our moving average analysis indicates that stocks are firming and a rally seems to be in progress. Have we seen the bottom of this bear market? That is very doubtful; nevertheless, the rally that is underway seems to have enough underlying strength to be tradeable.This combination of moving averages is reminiscent of the classic MACD (Moving Average Convergence Divergence) technical indicator and can be used in the same way.
Given that my indicator reflects action in the stock market as a whole, a way to use it is to go long index funds when the trend appears to be turning upward. For example, a week or so ago I somewhat prematurely nibbled at the ProShares Ultra S&P 500 ETF (SSO). Since then I have added a bit of the ProShares Ultra QQQ ETF (QLD).
Now that we are into November, perhaps we will be able to say "Yes, Virginia, there is a Santa Claus rally!"
Disclosure: long SSO and QLD
Comments
MyInvestorsPlace - trading, value,
investing, forex, stock, market, technical, analysis, systems
Post a Comment