OK, I'm well aware of all the fundamental issues facing this market: stubborn unemployment, slowing leading indicators, shaky real estate, the European crisis, etc. Markets, however, have a way of doing what they wish regardless of what may or may not be logical.
This post looks at the market as it is, not as is should be, and I'm convinced stocks are going up.
Our first piece of evidence is this list of all of this weekend's stock market BUY and SELL signals available at Alert HQ. Taken together, this is a picture of an improving market.
This weekend we have the following stock picks and signals:
Except for the reversal signals based on weekly data, pretty much every list of stock picks looks bullish. The Trend Leaders list is growing nicely week-over-week, the Trend Busters, Gaps, Swing Signals and Bollinger Band Breakouts all show more BUY signals than SELL signals. The reversal signals based on daily data are improving so strongly that it indicates the beginnings of a real bullish move. The consistency of the bullish bias across all our stock screens cannot be ignored.
As part of the Alert HQ process we summarize and track a number indicators across the whole universe of stocks and ETFs that we track and we generate a weekly set of charts. These charts are our second piece of evidence.
In the chart below we count the number of stocks above various moving averages and count the number of moving average crossovers, as well. We scan roughly 6400 stocks and ETFs each weekend and plot the results against a chart of the SPDR S&P 500 ETF (SPY).

Last week we saw the first glimmers of hopefulness but we wanted to see some confirmation. This week, I think it's safe to say that confirmation has been delivered. The crossover of the yellow line above the magenta line (in other words, the number of stocks above their 50-DMA has increased above the number of stocks whose 20-DMA is above their 50-DMA) has become definitive and this is something that we generally see with a market starting a real tangible rally.
The next chart provides our trending analysis. It looks at the number of stocks in strong up-trends or down-trends based on Aroon analysis.
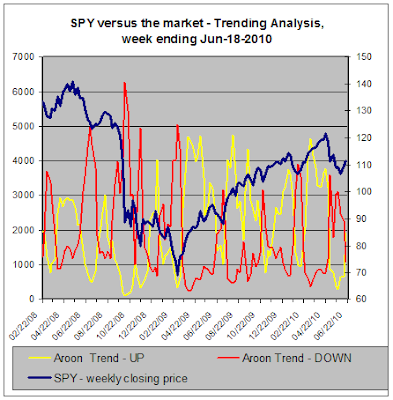
Here we're also seeing a crossover. In this case the red line describing the number of stocks in down-trends has begun to plunge while the yellow line describing the number of stocks in up-trends has finally jumped upward. In terms of trending, then, it appears the tide has turned and more stocks are in up-trends than are in down-trends.
Conclusion --
My intention here is just to describe market action and make an educated guess as to whether the current strengthening in stock prices will continue. From what I'm seeing, it looks like the path of least resistance for this market is UP. Not only are all these Trade-Radar indicators looking quite positive but, in another sign of recovery, major stock market indices have all moved above their 200-day moving averages.
With China's announcement that they will allow more exchange rate flexibility with the yuan, Asian markets are off and running as I write this post. This is bound to provide support for U.S. markets this week which should only serve to further strengthen the technical case for this market continuing to rally.
For now, bears should step aside.
This post looks at the market as it is, not as is should be, and I'm convinced stocks are going up.
Our first piece of evidence is this list of all of this weekend's stock market BUY and SELL signals available at Alert HQ. Taken together, this is a picture of an improving market.
This weekend we have the following stock picks and signals:
- Reversal Alerts based on daily data, we have 99 Alert HQ BUY signals and 3 SELL signals
- Reversal Alerts based on weekly data, we have 3 Alert HQ BUY signal and 25 SELL signals
- We have 64 Bollinger Band Breakouts based on daily data and 40 are bullish. We also have 108 Breakouts based on weekly data and 53 of them are bearish.
- We have 664 Cash Flow Kings
- 10 Swing Signals -- 9 are BUY signals and only one is a SELL signal
- 223 Trend Leaders, all in strong up-trends according to Aroon, MACD and DMI. We have 69 stocks that are new additions to the list and 34 that fell off the previous list.
- 94 Trend Busters based on daily data of which all but three are BUY signals. We also have 330 Trend Busters based on weekly data but in this case only 3 are BUY signals.
- 129 Gap Signals -- stocks with upside or downside gaps or gaps that have been closed. We see 52 downside gaps and 77 upside gaps based on daily data. We also have 41 Gap Signals based on weekly data or which 16 are bearish.
Except for the reversal signals based on weekly data, pretty much every list of stock picks looks bullish. The Trend Leaders list is growing nicely week-over-week, the Trend Busters, Gaps, Swing Signals and Bollinger Band Breakouts all show more BUY signals than SELL signals. The reversal signals based on daily data are improving so strongly that it indicates the beginnings of a real bullish move. The consistency of the bullish bias across all our stock screens cannot be ignored.
As part of the Alert HQ process we summarize and track a number indicators across the whole universe of stocks and ETFs that we track and we generate a weekly set of charts. These charts are our second piece of evidence.
In the chart below we count the number of stocks above various moving averages and count the number of moving average crossovers, as well. We scan roughly 6400 stocks and ETFs each weekend and plot the results against a chart of the SPDR S&P 500 ETF (SPY).

Last week we saw the first glimmers of hopefulness but we wanted to see some confirmation. This week, I think it's safe to say that confirmation has been delivered. The crossover of the yellow line above the magenta line (in other words, the number of stocks above their 50-DMA has increased above the number of stocks whose 20-DMA is above their 50-DMA) has become definitive and this is something that we generally see with a market starting a real tangible rally.
The next chart provides our trending analysis. It looks at the number of stocks in strong up-trends or down-trends based on Aroon analysis.

Here we're also seeing a crossover. In this case the red line describing the number of stocks in down-trends has begun to plunge while the yellow line describing the number of stocks in up-trends has finally jumped upward. In terms of trending, then, it appears the tide has turned and more stocks are in up-trends than are in down-trends.
Conclusion --
My intention here is just to describe market action and make an educated guess as to whether the current strengthening in stock prices will continue. From what I'm seeing, it looks like the path of least resistance for this market is UP. Not only are all these Trade-Radar indicators looking quite positive but, in another sign of recovery, major stock market indices have all moved above their 200-day moving averages.
With China's announcement that they will allow more exchange rate flexibility with the yuan, Asian markets are off and running as I write this post. This is bound to provide support for U.S. markets this week which should only serve to further strengthen the technical case for this market continuing to rally.
For now, bears should step aside.
Found a few stock picks you are interested in? If you are looking to refine your entry and exit points, you should take a look at what our friends at Hottinger's E-Zone Signals have to offer.
Comments
Post a Comment