It has sort of been an event driven week. The mid-term elections were held Tuesday and the Republican surge occurred as expected. Since this was not exactly a surprise, market reaction was just modestly positive. On Wednesday, the Federal Open Market Committee finally announced QE2 and provided the details of how it would be implemented - carefully and with restraint. Markets barely budged until Thursday, when stocks finally put on a strong follow-through rally. Friday, the Non-Farm Payroll report was published and surprised everyone with a relatively strong gain in private employment. Perversely, the market reaction was a big "ho hum".
So Thursday provided a big gain and every other day in the week provided just small gains which in total, though, added up to a pretty strong week for the stock market with the S&P 500 up 3.6% and the Russell 2000 up 4.7%. Does that mean we no longer have to worry about the deteriorating breadth that we were seeing for the last two weeks?
The view from Alert HQ --
For those readers who are new to TradeRadar, the data for the following charts is generated from our weekly Alert HQ process. We scan roughly 6200 stocks and ETFs each weekend and gather the statistics presented below.
In this first chart below we count the number of stocks above various moving averages and count the number of moving average crossovers, as well. We then plot the results against a chart of the SPDR S&P 500 ETF (SPY).
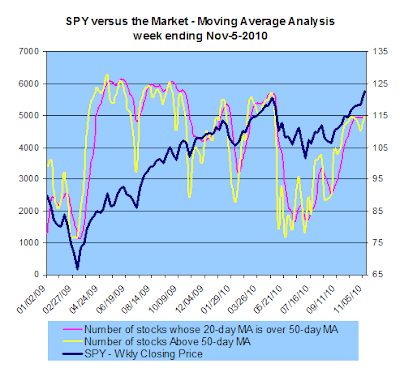
You can see that two weeks of deterioration has been wiped out in a flash. Now, the number of stocks above their 50-DMA has managed to just sneak above the number of stocks whose 20-DMA is above their 50-DMA (yellow line crossed above magenta line). We saw similar behavior in the spring of this year and it presaged an extension of the rally that was underway at that time. It now suggests we should have a couple more decent weeks before facing the prospect of a pull-back again.
The next chart provides our trending analysis. It looks at the number of stocks in strong up-trends or down-trends based on Aroon analysis.

Here, too, we a reversal in the indicators. Now, the number of stocks in strong up-trends is once again surging though the number of stocks in strong down-trends only decreased slightly (not so surprising since it is already at a very low level).
Conclusion --
As some pundits suggested, the election was already priced into the market. Investors apparently had a "don't fight the Fed" moment on Thursday that resulted in the week's one day of big gains. Friday's excellent employment report didn't light a fire under stocks but did serve to support current levels in the market. This suggests investor sentiment is positive but still cautious, a good backdrop for stocks to climb the infamous "wall of worry".
With breadth improving again, the Fed supplying liquidity and holiday hiring starting in earnest, conditions are looking better for stocks. In the short term, a few more weeks of strength followed by the pull-back everyone has been expecting for a while now should set us up for the next move higher.
Disclosure: none
Comments
Post a Comment