 This post is a combination of our Weekly Review (seldom seems to arrive on a weekly basis lately) and the Weekend Winners and Losers available at Alert HQ.
Today we have the following stock picks and signals:
- Reversals based on daily data, we have 11 Alert HQ BUY signals and 121 SELL signals
- Reversals based on weekly data, we have 1 Alert HQ BUY signal and 140 SELL signals
- We have 37 Bollinger Band Breakouts based on daily data and 212 Breakouts based on weekly data.
- We have 599 Cash Flow Kings
- 14 Swing Signals -- 9 BUY signals and 5 SELL Signals
- 59 Trend Leaders, all in strong up-trends according to Aroon, MACD and DMI. We have 11 stocks that are new additions to the list and 17 that fell off the previous list.
- 30 Trend Busters based on daily data of which 3 are BUY signals. We also have 50 Trend Busters based on weekly data.
- 283 Gap Signals -- stocks with upside or downside gaps or gaps that have been closed. We see 105 downside gaps and 178 upside gaps based on daily data. We also have 42 Gap Signals based on weekly data.
This weekend's Alert HQ signals start out with some pretty strong negativity with bearish reversals swamping bullish reversals. The Trend Busters look equally weak while the Trend Leaders continue to tread water at all time lows, the list being only 10% of what it was a month ago.
Glimmers of hope appear, however, in the Swing Signals where BUY signals again outnumber SELL signals and in the Gap Analysis list where upside gaps dominate.
With so many reversal SELL signals being registered, it's hard to say that the market has reached a bottom. Let's see if looking at some of the numbers we track at Alert HQ will shed any light on the question.
In the chart below we count the number of stocks above various moving averages and count the number of moving average crossovers, as well. We scan roughly 6500 stocks and ETFs each weekend and plot the results against a chart of the SPDR S&P 500 ETF (SPY).
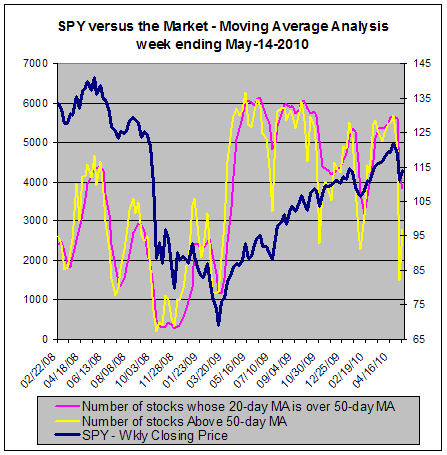
Despite what seemed like yet another meltdown on Friday, stocks seem to be bouncing back according to this chart. The number of stocks above their 50-day moving average (yellow line) went from less than 1500 last week up to almost 2800 this week. Not great but an improvement nonetheless. And it has been enough to nearly halt the drop in the number of stocks whose 20-day MA is above their 50-day MA (magenta line).
Though not shown on the above chart, the number of stocks above their 20-day moving average has gone from a deeply over-sold level of 658 last week up to 2048 this week. At least things are moving in the right direction.
The next chart provides our trending analysis. It looks at the number of stocks in strong up-trends or down-trends based on Aroon analysis.

Here, the phrase that comes to mind is "less bad". The number of stocks in strong up-trends has dwindled to levels last seen in November 2009. The "less bad" aspect is that the number of stocks in down-trends spiked last week but us considerably lower this week. That often seems to happen during a bottoming process as down-trends give way to neutral action which is followed by up-trends.
Looking at SPY in a little more detail, the next chart applies Fibonacci Retracement lines.

This chart shows a few things, none of them particularly encouraging. One thing is that Friday gapped lower and the gap was not closed. That is generally a bearish development. There is a former support line right around the Fibonacci 61.8% line that could soon act as resistance. And then there's Fibonacci. SPY fell almost to 0% line the day of the "flash crash", quickly rebounded all the way to a level above the 61.8% line and then on Friday, SPY traded across the full range between the 50% and 61.8% lines.
To sum up, we have a gap down which is bad, glimmers of hope in the Alert HQ signals, Alert HQ charts suggesting potential bottoming and Fibonacci showing we've bounced off almost every line possible.
Bottom line is that the charts have turned into a mess of volatility. I lean toward thinking the bottom is in but I wouldn't blame anyone for standing back and keeping this market at arms length.
On the economic front, retail sales this week were reasonably strong though not every retailer enjoyed equally good results. Bellwether Cisco reported excellent earnings and the usually cautious outlook served to sink the stock. I would rather see the Cisco glass as half full, not half empty, and that is a good sign for tech overall.
Coming up in the week ahead we will have reports on housing starts and building permits, PPI and CPI, the Conference Board's leading indicators and the Philadelphia Fed's manufacturing index. None of these is hugely market moving so I suspect the market will spend some time licking its wounds and keeping a wary eye on Europe.
Comments
Post a Comment