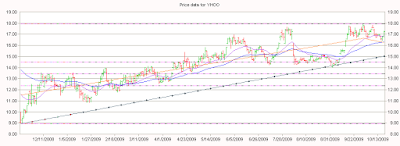
 Stocks are making new highs these days. This is the time when you should be preparing to lock in profits. That means setting stops.
Setting stops usually entails looking for levels where a stock's descent is liable to halt. If the stock falls below one of those levels, it is sold automatically.
The TradeRadar software can help. Here's how.
Assume you are long a particular stock. You want to set a stop that preserves a reasonable amount of your profit or prevents unacceptable losses. The trick is to set the stop at a point that is high enough to limit losses but low enough so that the stock has some room to move. After all, you don't want to be stopped out and then see the stock rebound.
To accomplish this delicate balancing act, investors commonly look at moving averages, trend lines, Fibonacci retracement lines and support levels.
As it turns out, the TradeRadar software automatically generates three of the four indicators mentioned above. Let's use Yahoo (YHOO) as an example.
All you have to do is click the Auto check box, select Sell Signal-Smooth and click the Update Chart button. The result is shown below (be sure to click the chart to see a larger image).

The TradeRadar software calculates and displays the 20-day moving average and the 50-day moving average. The 20-DMA is often considered too volatile to use as a stop but the 50-DMA is often used by traders. That would mean setting a stop a bit below the 16.25 level that the 50-DMA is currently sitting at.
The software also draws the upward sloping trend line. You could set the stop, therefore, a bit below the 15.03 level.
The software displays the Fibonacci retracement lines based on the price action within the window of data. In this example, the 38.2% retracement line at 14.50 makes a good stop since we see that prices had previously touched and held at this level several times earlier this year.
The Fibonacci lines also make it easier to identify support levels based on previous price peaks. You can see that between the 38.2% retracement line and the 50% retracement line, there are several price peaks that might provide support.
Conclusion --
This post shows how TradeRadar can help you quickly evaluate several alternative candidates for stops. Based on your tolerance for pain, you can choose the one that works for you.
Keep in mind, though, these methods should not be used directly on leveraged ETFs. You should always evaluate the underlying index and then translate the results using our Stop Calculator for Leveraged ETFs.
If you'd like to try the TradeRadar software, you can get it free at the Download page.
Comments
Post a Comment