 Take a few days off and something weird always happens. Goldman is accused of fraud (I'm shocked, shocked...) and the market tanks. In any case, I've been out of pocket since Thursday but I've had some help getting the Alert HQ signals out. What follows is a combination of our Weekly Review and the Weekend Winners and Losers where we announce the weekend's free stock signals available at Alert HQ.
Today we have the following stock picks and signals:
- Based on daily data, we have 3 Alert HQ BUY signals and 39 SELL signals
- Based on weekly data, we have 4 Alert HQ BUY signal and 5 SELL signals
- We have 67 Bollinger Band Breakouts based on daily data and 341 Breakouts based on weekly data.
- We have 625 Cash Flow Kings
- 33 Swing Signals -- 13 BUY signals and 20 SELL Signals
- 573 Trend Leaders, all in strong up-trends according to Aroon, MACD and DMI. We have 48 stocks that are new additions to the list and 166 that fell off the previous list.
- 12 Trend Busters based on daily data of which 5 are BUY signals. We also have 38 Trend Busters based on weekly data.
- 128 Gap Signals -- stocks with upside or downside gaps or gaps that have been closed. We see 33 downside gaps and 95 upside gaps based on daily data. We also have 46 Gap Signals based on weekly data.
We actually had a pretty decent week and Friday was the only significantly down day. Nevertheless, the Friday downdraft seemed to be enough to lend a noticeably bearish tone to this weekend's signals, especially in the ones based on daily data. We see SELL signals outnumbering BUY signals in most cases and, though the Trend Leaders list remains in good shape, there are more stocks falling off the list than gaining membership in the list. This is not a good sign. I also notice some of the double inverse ETFs generating BUY signals. This development is a warning sign that bears watching.
With all that said, let's take a look at some of the numbers we track at Alert HQ.
In the chart below we count the number of stocks above various moving averages and count the number of moving average crossovers, as well. We scan roughly 7000 stocks and ETFs each weekend and plot the results against a chart of the SPDR S&P 500 ETF (SPY).
Now we begin to see an element of confusion. I just discussed the bearish tone of Alert HQ's signals. Now, looking at the chart above, there seems to be very little wrong with this market. All the measures of moving average analysis that we track actually moved up this week.
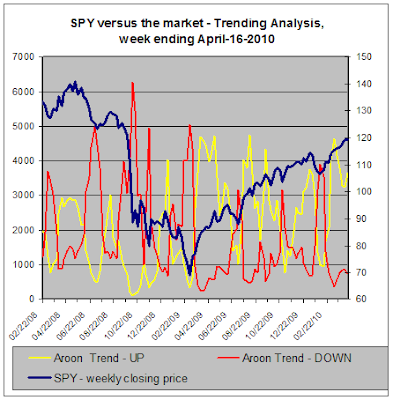
The next chart provides our trending analysis. It looks at the number of stocks in strong up-trends or down-trends based on Aroon analysis.
Here, too, things are looking good despite the weakness on Friday. This chart suggests the week was strong enough for most stocks to register gains and see a larger percentage of stocks exhibit up-trends.
The previous two charts contrast statistics for the whole market with the S&P 500. So it's worthwhile to take a more detailed look at a chart of the whole market. We'll use the Vanguard Total Market VIPERS ETF and look at some technical measures.
In this chart of VTI, it is easier to see the conflicting signals we discussed above. Williams %R is signaling SELL. On the other hand, MACD and Slow Stochastics are heading in a bearish direction but have not yet crossed the bearish threshold.
Conclusion --
With the technicals on the fence but leaning bearish and the market sinking with Goldman's reputation, earnings are probably the only thing that can save this market. On the positive side, Intel blew away earnings estimates as did JP Morgan Chase and both stocks found favor from investors. A worrisome sign, however, is that several bellwethers including GE, Google and UPS beat expectations and their stocks fell anyway.
The economic calendar this week is light but there is one thing that worries me. Durable Goods orders will be released on Friday. After the disappointing results for March manufacturing released this past week, another poor report on the manufacturing sector could weigh on the market. Manufacturing has been a bright spot in the recovery so far. A perception that the sector is faltering will certainly be a problem for stocks.
So with things looking pretty shaky at the moment, it seems like a good time to make sure your stops are updated and in order.


Comments
Post a Comment