 Stocks dropped this past week but thankfully it could not be considered a rout. It is almost unbelievable that for the S&P 500 this is only the third down week we have seen since early March!
Though down like all the other indexes, the NASDAQ was the week's best performer. This was despite a sell-off in Blackberry maker Research in Motion (RIMM) who announced better than expected earnings but delivered an uninspiring forecast and solid but not overwhelming debut for Apple's new iPhone.
On the economic front, the Industrial Production and Capacity Utilization report showed that manufacturing slid again in May after a couple of months of improvement while factory utilization continues to drift at record low levels. The housing market showed more small signs of improvement but it wasn't enough to keep stocks moving up.
The view from Alert HQ --
Charts of some of the statistics we track at Alert HQ are presented below:

The chart above shows our analysis of the universe of stocks we evaluate, roughly 7200 of them. A couple of weeks ago, I said that we can see from these moving average statistics that after a very constructive phase we have been going through a period of indecision. Prior to that I had said things looked "toppy". After this week's modest market decline, these conclusions look ever more accurate. Still, they don't necessarily provide a clear indication of the path forward though the bias does seem to be downward now.
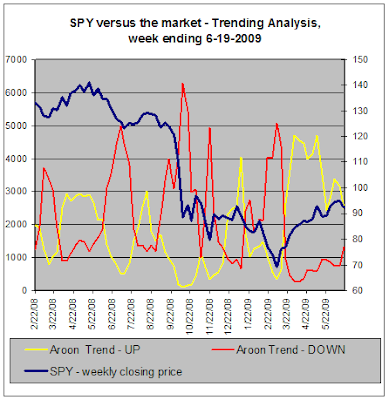
The next chart provides our trending analysis. It looks at the number of stocks in strong up-trends or down-trends based on Aroon analysis.

While the number of stocks in strong up-trends is not extremely high, it is clear stock prices have been stagnating, with this number moving up and down within a range that is a bit below the middle of our scale.
The number of stocks in strong down-trends is still rather low but it has been increasing slowly for the last few months. As the weakest of the stocks that were caught in the post-March low updraft begin to give up unsustainable (undeserved?) gains, this indicator should indeed be coming off the extreme lows seen a couple of months ago.
The following chart show SPY, the S&P 500 SPDR ETF. I have drawn two line on the chart: the blue line is the up-ward trend line and the magenta line is the first support line.

It can be seen that SPY has violated both lines, dropping below the trend line and dropping below the support line.
Does this mean the market is about to plunge?
It is hard to think we won't see more weakness but it is even harder to think the market will plunge. From a technical point of view, the initial support line was too close to the recent high so it is no wonder it was violated. The trend line is fairly steep, so no surprise that it, too, was violated. Note that the 50-day moving average just crossed above the 200-day moving average. This is generally considered a bullish signal for chart watchers. SPY also approached its 200-day MA but did not break below it, also a good sign.
On the other hand, if SPY doesn't jump over the trend and support lines illustrated above and regain its highs, then we are no doubt headed down to the region around $90 or even $87. That would equate to drops of 2.1% and 5.4%, not very serious pullbacks at all.
Conclusion --
Our charts show stocks range bound with a better than 50% chance of further weakness. The refrain lately among stock market pundits is that investors are now looking for real economic improvement, not just the "less bad" theme.
Accordingly, we will have plenty to chew on this week. The economic calendar is full with Existing Home Sales, the Durable Goods report, New Home Sales, the FOMC rate decision (the statement will no doubt be more important that the actual rate decision), initial jobless claims, the final numbers for Q1 GDP (old news by now), Personal Income, Personal Spending, PCE Core (all liable to market moving for the consumer discretionary sector) and the Michigan Comsumer Sentiment report.
Dare I say it? Markets seem to have returned to normalcy. Stocks weaken when the economic backdrop dims. Banks are returning TARP money and resuming some measure of independence. Major averages are not showing extreme volatility. A few people are even buying houses.
A pullback seems in the cards now. As long as it is only a moderate pullback it can probably be considered a healthy development, allowing time for the economy to develop a few more signs of recovery which could provide the catalyst for the next move up. In the meantime, stocks are looking tired.
Comments
Post a Comment