This weekend I have a bigger than usual list of Alert HQ BUY signals based on daily data so I began to browse through them. Clicking on the column headings allows you to sort by that data element. I started by sorting by Signal Strength. I was surprised to see a bunch of REITs at the top of the list.
After spending last fall in a trading range, many REITs surged into the end of December and then fell back in the new year.They now appear to be making an effort to climb back to new highs.
I'm no expert in the fundamental analysis of REITs. What I can say is that it's worth paying attention when an entire sector begins to move. Here is the list of REITs that are on this weekend's buy list:
Count 'em up and there are 18 REITs generating BUY signals this weekend. Most of them have pretty strong signal strength. Many, though not all, have broken out above their downward-sloping trendline. Here, as an example, is the ISHARES DJ US REAL ESTATE ETF (IYR) whose holdings include a selection of REITS:

There's a lot of interesting stuff going on with this chart. This ETF has broken above it's trend line and moved above both it's 20-day and 50-day moving average. MACD is bullish and the 200-day moving average is heading upward. All of that is bullish from an intermediate-term point of view.
From a short-term point of view, both the Slow Stochastics and Williams %R indicate this ETF is well over-bought. This suggests a pullback could be in the offing though not necessarily right away. This rally could last for weeks if the overall market is doing decently.
This next chart is of an actual REIT rather than an ETF. It is for AVALONBAY COMMUNITIES (AVB):
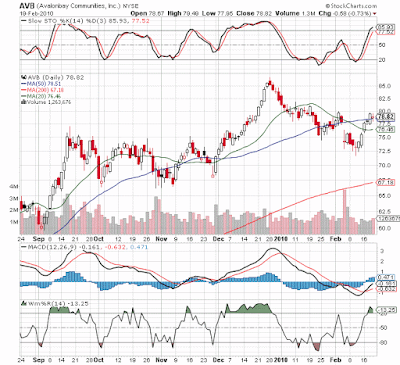
As you can see, this REIT shows pretty much all the same characteristics as the ETF.
Conclusion --
So even with all the constant reminders of banks stuck with bad commercial real estate loans, it seems investors are focusing on the positive. The attitude must be that the larger properties, the kind that typically make up the majority of holdings in REITs and ETFs, have seen the worst of the downturn, offer value at this point and will benefit from a slowly improving economy.
For those who are comfortable with REITS, it looks like the BUY signal is here. And note that quite a few of them offer decent dividend yields.
Disclosure: none
After spending last fall in a trading range, many REITs surged into the end of December and then fell back in the new year.They now appear to be making an effort to climb back to new highs.
I'm no expert in the fundamental analysis of REITs. What I can say is that it's worth paying attention when an entire sector begins to move. Here is the list of REITs that are on this weekend's buy list:
| Symbol | Name | Signal Strength | Dividend Yield |
|---|---|---|---|
| ARE | ALEXANDRIA RE EQUITIES | 99% | 2.27% |
| AVB | AVALONBAY COMMUNITIES | 99% | 4.53% |
| BXP | BOSTON PROPERTIES, INC. | 91% | 3.00% |
| FIO | ISHARES FTSE NAREIT INDUSTRIAL/OFFICE CAPPED INDEX FUND | 88% | N/A |
| FRT | FEDERAL REALTY INV. TRUST | 99% | 3.85% |
| FTY | ISHARES FTSE NAREIT REAL ESTATE 50 INDEX FUND | 97% | N/A |
| HIW | HIGHWOODS PROPERTIES,INC. | 99% | 5.71% |
| HR | HEALLTHCARE REALTY TRUST | 72% | 5.76% |
| IYR | ISHARES DJ US REAL ESTATE | 96% | N/A |
| PPS | POST PROPERTIES, INC. | 86% | 4.31% |
| PSR | POWERSHARES ACTIVE U.S. REAL ESTATE FUND | 87% | N/A |
| REZ | ISHARES FTSE NAREIT RESIDENTIAL PLUS CAPPED INDEX FUND | 96% | N/A |
| RTU | COHEN & STEERS REIT AND UTILITY INCOME FUND, INC. | 96% | 13.21% |
| UBP | URSTADT BIDDLE PROPERTIES | 68% | N/A |
| URE | PROSHARES ULTRA REAL ESTATE | 99% | N/A |
| VNQ | VANGUARD REIT ETF | 92% | N/A |
| IFNA | iShares FTSE EPRA/NAREIT North America Index Fund | 86% | N/A |
Count 'em up and there are 18 REITs generating BUY signals this weekend. Most of them have pretty strong signal strength. Many, though not all, have broken out above their downward-sloping trendline. Here, as an example, is the ISHARES DJ US REAL ESTATE ETF (IYR) whose holdings include a selection of REITS:

There's a lot of interesting stuff going on with this chart. This ETF has broken above it's trend line and moved above both it's 20-day and 50-day moving average. MACD is bullish and the 200-day moving average is heading upward. All of that is bullish from an intermediate-term point of view.
From a short-term point of view, both the Slow Stochastics and Williams %R indicate this ETF is well over-bought. This suggests a pullback could be in the offing though not necessarily right away. This rally could last for weeks if the overall market is doing decently.
This next chart is of an actual REIT rather than an ETF. It is for AVALONBAY COMMUNITIES (AVB):

As you can see, this REIT shows pretty much all the same characteristics as the ETF.
Conclusion --
So even with all the constant reminders of banks stuck with bad commercial real estate loans, it seems investors are focusing on the positive. The attitude must be that the larger properties, the kind that typically make up the majority of holdings in REITs and ETFs, have seen the worst of the downturn, offer value at this point and will benefit from a slowly improving economy.
For those who are comfortable with REITS, it looks like the BUY signal is here. And note that quite a few of them offer decent dividend yields.
Disclosure: none
Comments
Post a Comment